The basic essentials of XPS (ESCA) analysis
1. Main characteristics
X-ray Photoelectrons Spectroscopy (XPS) analysis is also known as Electron Spectroscopy for Chemical Analysis (ESCA). This technique can provide the atomic composition at a sample surface as well as the type of the existing chemical bonds and their distribution.
One measurement provides information on the mean materials characteristics over the first 10nm under the surface. However, composition profiles as a function of depth can be obtained down to 500nm by using successive ionic abrasions (alternation measurement/sputtering/measurement/sputtering…).
One analysis covers a 10µm to 200µm sided surface. Imaging capacities are available. All elements except hydrogen and helium can be detected in a single measurement. The matrix atomic composition can be directly computed without using any standard (no matrix effect as opposed to SIMS analysis). Detection limits are in the range 0.1at% to 0.5at% (much less sensitive than SIMS).
The distribution of chemical bonds types in the sample can be extracted. For instance, it is possible in a polymer to calculate the abundance of C-C bonds relatively to the abundance of C=C bonds, C-O bonds…
2. Typical use
This technique is well-suited for oxides, surface treatments or material coatings analysis. More generally, it is also adapted to the search of abundant impurities, for quantifying matrix compositions or to deduce information about a material structure thanks to a chemical bonds analysis. It can be applied to conductors as well as insulators (oxides, polymers, powders …).
3. Physical aspects
During an analysis, the sample is lightened by a X-ray beam. The X-ray source is monochromatic, the most current energies are 1486.6eV (Al) and 1253.6eV (Mg). Under the influence of high energy photons, the deep levels electrons can be excited and ejected from the atoms. The free electrons have a kinetic energy which depends on:
- the X photon energy,
- the binding energy of the electronic level on which the electron was located.
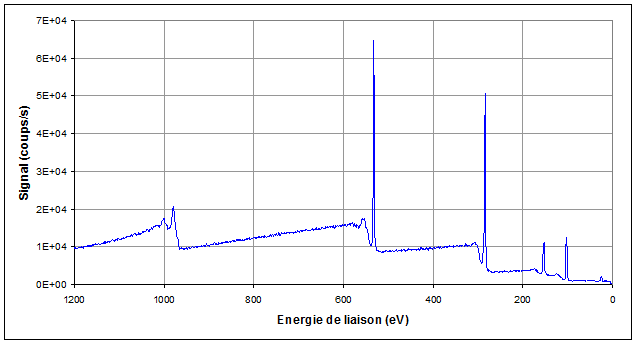
Once it is free, an electron moves along in the sample. Then, it may be, or not, affected by inelastic or elastic collision. The mean free path is typically a few nanometers. When the atom the electron comes from is located at less than 10nm from the surface, there is a good probability that the electron emerges from the sample and reaches the spectrometer, in the vacuum vessel which is under ultra-high vacuum (10-9 to 10-10Torr). The electrons ejection out of the sample generates some electrostatic charges on insulators. These can be exactly compensated by using an electrons gun. Any type of insulating sample can thus potentially be analyzed. The spectrometer enables to measure the entering electrons kinetic energy. After a scan of the whole energy range, a binding energy spectrum is built up (see figure 1). The spectrum includes:
- a few peaks which correspond to the atoms electronic levels binding energies,
- a background which comes from the inelastic collisions which decrease more or less the electrons kinetic energies.
Each peak is specific to the atom it comes from so that a spectrum enables to find the elements the sample surface is made of.
The state of a valence electron highly depends on the atom environment, but this is not the case for a deep level electron. Thus, the matrix effect which is important in SIMS analysis is almost non-existent in XPS measurements. By integrating the peaks related to the various elements which constitute a sample, it is possible then to calculate the matrix composition. The calculation implies free mean path and cross section values which are established. The measurements accuracy reaches 2-5% for relative values and 10-20% for the quantified values. Some particular cases may necessitate a result interpretation, especially for analysis made after ionic abrasion (see below): reoxidation of a surface after sputtering, contamination by the residual atmosphere, segregation effects…
Although the influence of neighbour atoms on a deep electronic level is very weak, it generates some visible effects on spectra. Thus, according to the type of chemical bond (single, double …) and to the neighbour atoms, the binding energy of a given state can be shifted from a fraction of eV up to several eV. When several chemical bonds types are present, the spectrum peaks are splitted into several « secondary peaks » which are sometimes almost merged (see figure 2 below).
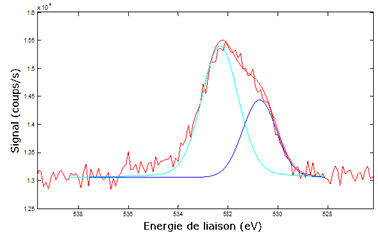
Some softwares can deconvolute a peak into its components, each component corresponding to a particular bond type. By calculating the integrals ratios, one can find the bonds types distribution. The following example shows the result of the measurement of the silicon bonds types distribution in a layer of SiOC:
| C2-Si-O2 | C-Si-O3 | Si-O4 |
| 50.4 | 39.7 | 9.9 |
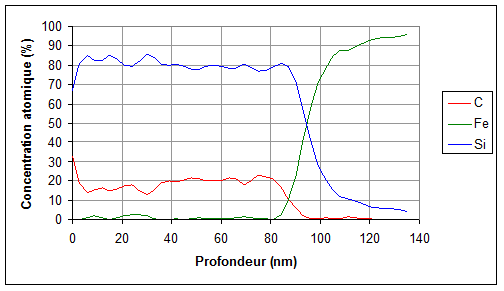
In order to determine a sample composition at depths higher than 10nm, one analysis can be made after ionic abrasion of the surface with argon ions. By making a measurements series at increasing depths, a composition profile as a function of depth can be reconstituted (see figure 3 below).