Physical description of SIMS analysis
1. General outline
The main parts of a magnetic sector SIMS equipment are:
- one or several ions sources,
- the primary column,
- the analysis chamber where the sample is placed,
- the secondary column that contains the mass spectrometer,
- several ions detectors.
The vacuum chamber is submitted to ultra-high vacuum pressures (<10-9 T).
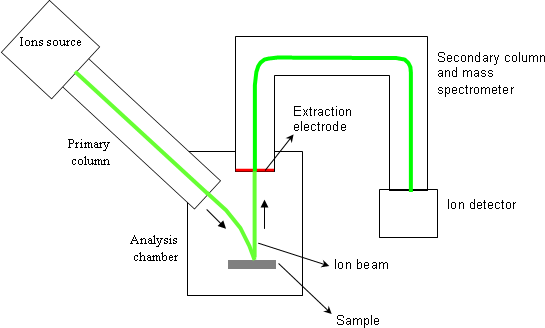
During one analysis, the primary column generates an accelerated and focused ion beam. The sample to be analyzed is bombarded by this beam which is called « primary beam ». With typical analysis conditions, the primary beam has a few microns probe size. A scanning is applied to that probe so as to homogenize the bombardment and to cover, on the sample, a square surface ranging from 20×20μm2 to 500×500μm2.
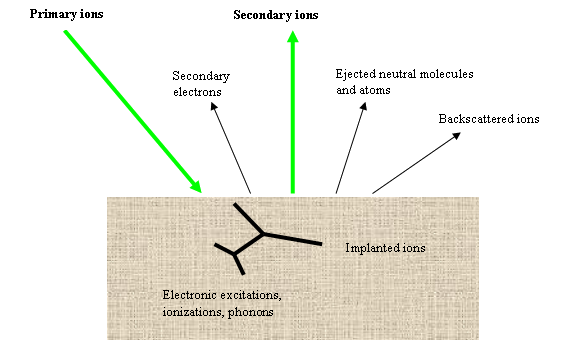
Cs+ et O2+ are the most frequently used primary ions. The primary ions strike the sample with an oblique incidence angle. Each ion reaches the sample with an energy which typically ranges from 500eV to 15keV. The primary ions generate various phenomena on sample surface (figure 2), and particularly they eject the surface atoms. As a consequence, the primary beam gradually digs a crater at the sample surface. The primary beam scanning leads to the formation of a flat bottomed square crater (20μm to 500μm sided). In order to discharge sample surface from electric charge, the sample should preferably be conductive, but insulating material can also be analyzed thanks to specific processes (surface metallization, electron beam bombardment).
A fraction of ejected atoms is ionized and constitute the « secondary ions ». These ones are used to measure the atomic concentrations. A positive or negative voltage is applied between the sample and the extraction electrode (1-10keV). A positive polarity extracts positive secondary ions whereas a negative polarity extracts negative ions. The secondary column has a filter function:
- spatial filter: a diaphragm selects the secondary ions that come from a disk at the crater center.
- mass filter: the spectrometer selects the ions that have a given atomic mass (tuned by the user).
- energy filter: used for specific cases.
Secondary ions that pass over all filters are finally counted by an electron multiplier or a Faraday cup.
2. Primary column
For a normal incidence at 10keV, Cs+ ions have their implantation peak at approximately 12nm depth. Penetration depths vary typically between 2 and 20nm according to analysis conditions.
Figure 3 shows the main parts of a primary column example. The ion source is biased at several kilovolts. The most frequently used primary ions are O2+ and Cs+. Primary and secondary columns are similar to optical systems where photons would be replaced by ions. Various devices affect the beam propagation: electrostatic lens, diaphragms, slits and deflectors.
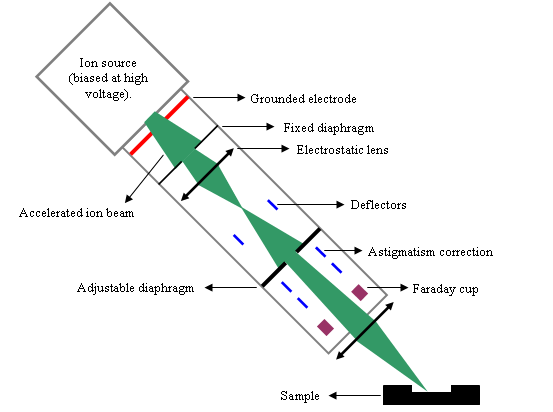
The main functions of the primary column are:
- tuning the beam intensity (1nA-10μA),
- focusing the primary beam on sample surface,
- scanning the sample surface over a square area,
- aligning the crater in the « optical » axis of the secondary column.
The probe size (beam diameter at sample surface) can be reduced to approximately 1μm when the beam is little intense (this is used for imaging capabilities). With standard analysis conditions that are required by concentrations profiles, the probe size is larger than 10μm in diameter.
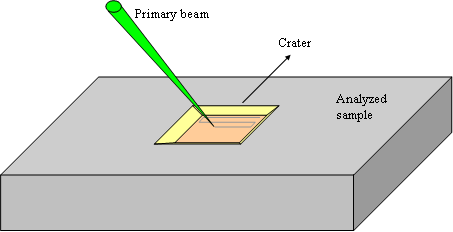
The beam scanning homogenizes the ions bombardment on the whole analyzed area and thus produce a flat bottomed crater (figure 4). The crater bottom flatness is essential for high depth resolution. The scanned area is chosen between 20×20μm2 and 500×500μm2.
3. Sample ionic bombardment
3.1 Stopping power
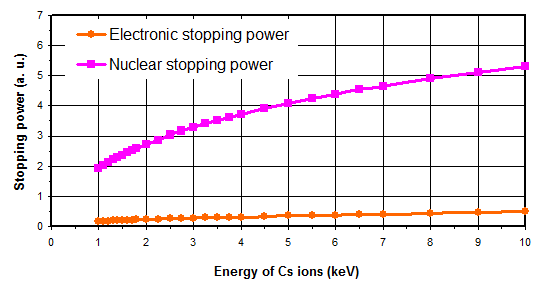
The primary beam bombards the sample with an energy ranging from a few hundreds of eV to 15keV and with an incidence angle in the range 20° to 70°. The stopping power is the ability of a material to slow down and stop an incidental ion. It is defined as the kinetic energy lost by the ion per distance unit. It can be split up into three terms:
- nuclear stopping power (collisions between ion and target atoms nuclei),
- electronic stopping power (coupling between ion and target atoms electrons),
- exchange stopping power (negligible, exchange of electric charges between ion and target).
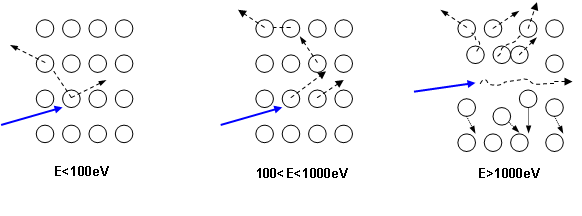
As illustrated in figure 5, for the primary ions energy range used for SIMS analysis, the main contribution is the nuclear stopping power. As a consequence, the sputtering phenomenon is the result of the ion momentum transfer toward target atoms (figure 6). For high energies, all atoms near the impact are moved, then resulting in a local warming. For typical SIMS analysis, except for low energy profiles (high depth resolution), the primary ions energy is higher than 1keV. As all the atoms near the impact area are moved, a species redistribution occurs under the surface (instantaneous surface since it is constantly eroded). This phenomenon, called « collisional mixing », limits the depth resolution of concentration profiles. The thickness of the disturbed zone depends on the penetration depth of primary ions, which is linked to impact energy and incidence angle. For Cs+ ions impacting a silicon sample at energies in the range 1-15keV, the practical following relation can be used:
p=3.9(E)1/2cos(θ)
p: Cs+ ions implantation peak depth (nm).
E: impact energy (keV).
θ : incidence angle in relation to the normal.
For a normal incidence at 10keV, Cs+ ions have their implantation peak at approximately 12nm depth. Penetration depths vary typically between 2 and 20nm according to analysis conditions.
3.2 Impact energy, incidence angle
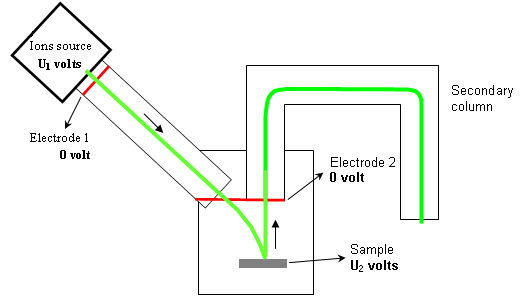
Electrostatic potentials that accelerate or slow down the ions are illustrated on figure 7. The voltage U2 (applied on the sample) is made positive for detecting electropositive ions (Na+ , Mg+ , Fe+ …) and negative for detecting ions with a high electronic affinity (O–, S–, Cl–…). But this polarity has also a very high influence on primary ions impact energy. For example:
- For U1=+3kV and U2=-2kV: the impact energy is 5keV
- For U1=+3kV and U2=-2kV: the impact energy is 1keV (5 times lower!)
As a consequence, much lower impact energies can be reached with positive ions analysis than with negative ions analysis. Thus, due to the collisional mixing effect, the depth resolution is worse when detecting negative ions.
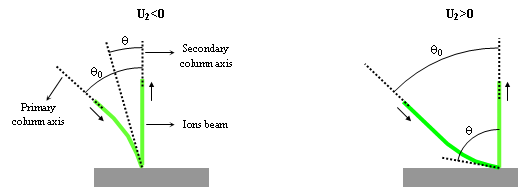
The secondary voltage has another consequence on primary ions incidence angle on sample surface. As illustrated on figure 8, when the primary ions come close to the sample, they accelerate if U2 is negative and they slow down if U2 is positive. It gives 2 types of trajectories. This also plays an important role on depth resolution and sputtering conditions. For example:
- For U1=+3kV and U2=+2kV: θ ≈ 60°
- For U1=+3kV and U2=-2kV: θ ≈ 23°
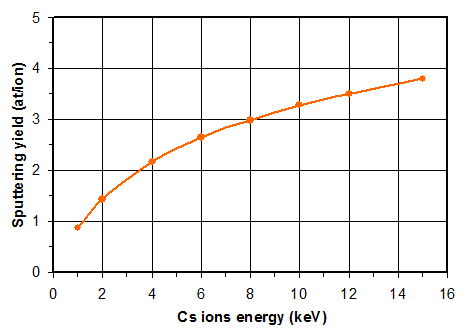
3.3 Sputtering yield
The sputtering yield is defined as the average number of atoms (neutral or ionized) ejected by one ion impact. The binding energy strongly influences the sputtering yield (the sputtering rate varies by a factor 5 or more depending on the matrix).
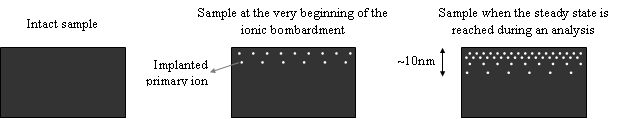
Figure 9 shows a calculation example using a Monte Carlo code for a typical SIMS analysis case. The calculated sputtering yields remain lower than 4 in this case. As almost all primary ions remain implanted, it means that a steady state is forming as the superficial layers are eroded (figure 10). The material which is sputtered when the steady state is reached is a combination that includes cesium or oxygen atoms (depending on the primary ions Cs+ or O2+). In the first nanometers, the sample surface can contain high concentrations of atoms coming from the primary beam.
Most sputtered particles are monoatomic, but a fraction of them is made up of clusters of several atoms. Thereafter, we will be interested more particularly by species made up of one atom of a minor element (concentration typically lower than 1%) and possibly one or more atoms coming from the matrix or the primary beam. For instance, let us consider a phosphorus doped silicon wafer bombarded by Cs+ ions. Among the emitted species, one will find: Si, SiCs, Si2, P, SiP, CsP, Si2P, etc. Let us consider ions and molecules of the type AnZ where Z is a minor element and A a major element (n can be null). In most cases, the number of produced particles of AnZ species is proportional to the concentration of Z in the sample:
Ipul(AnZ)=IpC(Z).K(AnZ)
Ipul(AnZ): flow of AnZ sputtered particles, neutrals and ions (particles per second).
Ip: primary beam intensity.
C(Z): concentration of element Z in the sample.
K(AnZ): sputtering coefficient.
3.4 Secondary ionization rate
The sample sputtering generates the ions known as « secondary ions ». In most cases, they constitute only a small fraction of the total number of sputtered atoms and molecules. For a species i, the ionization rate α is written:
α(i)=Nion(i)/No(i)
Nion(i): number of ionized particles of species i.
No(i): total number of sputtered particles of species i.
This parameter has much importance since only ions are detected. It is important to note that the ionization rate of a given species depends on the electronic properties of this species (electropositivity, electronic affinity) but also on the electronic properties of atoms that surround it into the sample (matrix effect). Two important consequences result from that:
- the standard samples (which are used as references to calculate concentrations) must have the same matrix than the analyzed samples.
- the primary ions have a great influence on the ionization rate because these ions are heavily implanted into sample superficial layers.
In order to detect as many ions as possible, the operator must carefully choose:
- the primary ions,
- the secondary voltage polarity (i.e. the detected ions polarity),
- the detected species (monoatomic ion or combination with major elements).
The detection limit can vary by several decades depending on a good or bad choice of analysis conditions!
Three main analysis modes can be distinguished:
- O2+ primary ions and positive secondary ions detection,
- Cs+ primary ions and negative secondary ions detection,
- Cs+ primary ions and detection of MCs+ or MCs2+ type secondary ions where M is an atom of the searched element.
The sputtered particles are mainly monoatomic (neutral and ions). For this reason, monoatomic ions are detected in most cases. For instance, in order to find phosphorus or fluorine atoms which have a high electronic affinity, P– or F– ions are detected (with Cs+ primary ions). At the opposite, for elements such as aluminum or magnesium which are electropositive, Al+ or Mg+ ions are detected (with O2+ primary ions). Figure 11 shows which species are usually detected with each one of the three analysis modes described above. In particular cases, another mode than the one indicated in the table can be used to detect a given element. The most important cases where polyatomic ions are detected are the MCs+ and MCs2+ analysis modes. These modes are particularly useful for measuring matrix compositions (stoichiometry of SiOx, AlxGa1-xAs, …) because they decrease the « matrix effect » (the influence of matrix composition on the ionization rate).
| Primary ion | Secondary ions polarity | Secondary ions |
|---|---|---|
| O2+ | positive | Al+, Ar+, B+, Cr+, Fe+, In+, Mg+, Mo+, Na+, Ta+, W+ and more generally M+ where M is a metal. |
| Cs+ | negative | Au–, Be–, C–, Cl–, F–, Ge–, H–, O–, P–, Si–, S–, Sn–, Te– where M is a matrix element. |
| Cs+ | positive | MgCs+, ZnCs+ and ions of the type MCs+ and MCs2+ where M is a matrix element. |
Let us consider the secondary ion AnZq (Z is a minor element, A a major element and q the ion electric charge). The intensity of such a beam can be written:
Iemit(AnZq)=IpC(Z)K(AnZ)α(AnZq)
Iemit(AnZq): flow of ions with a charge q emitted by the sample.
Ip: primary beam intensity.
C(Z): concentration of element Z in the sample.
K(AnZ): sputtering coefficient of species AnZ (see previous section).
α(AnZq): ionization rate for ions with an electric charge q (independent of C(Z)).
If the element Z exists with an atomic concentration higher than or close to 10%, then K and α terms depend on the concentration C(Z) (matrix effect). In that case, this concentration cannot be calculated anymore, except possibly by using the MCs+ or the MCs2+ mode.
4. Secondary column
4.1 General outline
Figure 12 shows the main parts of a secondary column. When the sample is « lighted » by the primary beam, each point of the sample is the equivalent of an ion source (in the same way that each point of an object lighted by a pencil of light is a source of light). The secondary column constitutes an electrostatic optical system which forms various types of ionic « images » on each diaphragm or slit of the system. These images are formed thanks to the electrostatic lenses, the electrostatic sector and the mass spectrometer electromagnet. Each slit or diaphragm can be widened, narrowed or shifted in order to select the desired information.
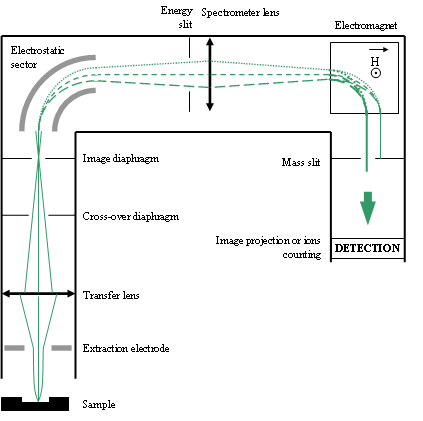
The most important components are:
- the cross-over diaphragm (Fourier plane),
- the image diaphragm (an ionic image of the sample surface is projected on it),
- the energy slit (kinetic energy filtering for spe cific cases)
- the mass slit
The mass slit filters the ions according to their mass or more precisely, according to their M/q ratio (M: ion mass, q: electric charge). In general, very few ions have more than one elemental electric charge. For this reason, we will speak thereafter primarily about their mass.
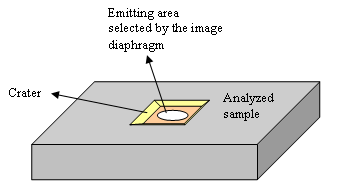
4.2 Aberrations filtration, spatial filtration
The secondary column electrostatic devices have aberrations. When an improved optical quality is required, the cross-over diaphragm can be adjusted so as to filter some of these aberrations. This is used to reach high mass resolution conditions which are required to resolve mass interference (for example between 31P et 30Si1H). In many cases, it is preferable to use a large aperture in order to let pass as much signal as possible. An ionic image of sample surface is projected on the image diaphragm. This diaphragm selects the ions that come from a disk located at the crater centre (figure 13). For obtaining a good depth resolution, a small diameter is used so as to decrease the side effect (crater edges emit ions that mixes the « depth » information). If the depth resolution is not important, one can use the largest diaphragm to increase the signal.
4.3 Secondary ions energy distribution
The secondary ions do not have all exactly the same kinetic energy due to the collisions cascade into the sample (sputtering process). The spectrometer design is such that this « chromatic dispersion » is compensated. For specific cases, an energy filtering is used to resolve some mass interference problems.
4.4 Mass filtration
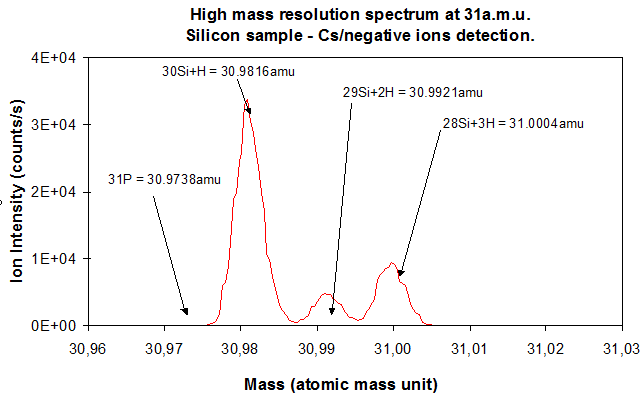
The electromagnet and the mass slit have an essential role since the electromagnet separates the trajectories of ions that have different masses and the mass slit selects the ions which are in a given mass range (figure 12). This mass range is chosen by tuning the spectrometer magnetic field. However, some parameters are likely to mix the mass distribution. One of these parameter is the secondary ions energy dispersion. As explained in section 4.3, this « chromatic dispersion » problem is solved thanks to the spectrometer design (see figure 12). The electrostatic sector and the spectrometer lens are routinely tuned before any analysis. The other major factor which perturbs the mass distribution is the dispersion of secondary ions emitting directions at the sample surface during sample sputtering. This phenomenon is critical when very close masses have to be separated, for example 31P (M=30,974) and 30Si1H (M=30,982). In such cases, the cross-over aperture is reduced to select the secondary ions that are emitted in a very narrow emission cone. Both cross-over and mass slit have to be very finely tuned to reach high mass resolution settings. The mass resolution is valued thanks to the ratio M/∆M where M is the ion mass and ∆M the smallest mass difference which can be resolved. This ratio does not depend on the ion mass. With basic analysis settings, the mass resolution is 300 (low mass resolution). For extreme cases, the mass resolution can be increased up to 12000 (very high mass resolution). For separating 31P from 30Si1H, a mass resolution near 3600 is required. The main drawback of this type of settings is a considerable reduction of the transmitted signal.
4.5 Transmission factor
All the secondary ions emitted are not collected by the detection device. A number of them are lost (electrostatic lenses, diaphragms, etc). The transmission factor is the ratio between the number of detected ions and the number of secondary ions of the same species that are emitted by the sample. The detected intensity can be written:
Id(AnZq)=IpC(Z)K(AnZ)α(AnZq)η(AnZq)
Id(AnZq): flow of detected ions.
Ip: primary beam current.
C(Z): concentration of element Z in the sample.
K(AnZ): sputtering coefficient of species AnZ.
α(AnZq): ionization rate for ions with an electric charge q (independent of C(Z)).
η(AnZq): transmission factor of the apparatus.
The above relation shows that the detected ions beam intensity is related to the concentration C(Z) in a indirect way. It also highlights the importance of the choice of appropriate experimental conditions since the values of coefficients K,α and η depend closely on the choice of the primary ion, its energy, the species detected, their polarity and the settings adopted for the devices of ions collection, spectrometry and detection. According to the values of these parameters, the product K(AnZ)α(AnZq)η(AnZq) may vary over several decades, thus modifying as much the signal level. But the signal level is not the only factor to be taken into account and the analyst has often to find the best compromise between incompatible parameters such as high signal versus very high mass resolution, high depth resolution versus deep profiles, etc.
5. Detection
Several detection devices can be used. If the goal is to provide a concentration profile or a mass spectrum, secondary ions are detected by an electron multiplier. A multiplier is made up of a series of electrodes which generates an electrons avalanche at each ion impact. This device enables to count individually all the ions that reach it up to rates near from 106 counts/s with a very weak background noise. The detection is linear over a very large signal range (6 to 7 decades) which enables to detect simultaneously traces and major elements. A simple Faraday cup, much less sensitive, can replace it as a counting device when the ions beam is too intense.
Imaging capabilities can be provided either by the electrons multiplier or by the « microscope » mode. With the electrons multiplier, images are reconstituted point by point by synchronizing the detected signal with the primary beam scanning (principle of a scanning electron microscope). Then, the spatial resolution depends on the primary beam probe size. This one can be optimized to reach approximately 1μm. In the « microscope » mode, the secondary column is used to project on a resistive anode an ionic image of the sample surface (principle of a traditional optical microscope).