SIMS analysis: depths and concentrations calculation
1. Concentrations
1.1 Minor elements concentrations
The matrix effect constraint is an important aspect of SIMS analysis. The ionization rate depends on the sample matrix. For example, a silicon sample and a GaAs sample which both contain the same aluminum concentration and which are analysed with exactly the same settings will produce extremely different Al+ ions signals. Due to this effect, several limitations exist when one wishes to calculate a concentration. To calculate a concentration profile of an element Z:
- except with particular conditions, the concentration has to be very small (typically lower than 1%): in such a case, there is a linear relation between detected signal and concentration.
- it is essential to dispose of a standard made of the same material. Probion disposes of a standards collection which covers nearly all needs in the field of semiconductors. Standards are generally obtained by ion implantation. If no standard is available for a given case, other solutions exist (please contact us for details).
If Z is effectively a minor element, the detected signal Id can be related to the concentration C(Z) by the following relation (see « Physical description of SIMS analysis »).
Id(AnZq)=IpC(Z)K(AnZ)α(AnZq)η(AnZq)
Id(AnZq): flow of detected ions.
Ip: primary beam current.
C(Z): concentration of element Z in the sample.
K(AnZ): sputtering coefficient of species AnZ.
α(AnZq): ionization rate for ions with an electric charge q (independent of C(Z)).
η(AnZq): transmission factor of the apparatus.
The concentration C(Z) in the sample is determined by using a standard for which the concentration or the dose of Z element is known. Due to above reasons, the standard must imperatively be constituted of the same matrix and be analysed in the same conditions than the sample whose concentration has to be determined. In order to free from some experimental variations such as the sputtering rate, the intensity of a reference species R, constituted by one or several major elements atoms, is measured in addition to AnZq species intensity. This species:
- must be constituted of major elements that have the same abundance in the standard sample and in the sample to analyse,
- must be detected with the same analysis conditions as the ones used for AnZq.
For instance, with an InP sample, the 113In– ion signal could be used as a reference signal.
Thus, the same settings are used to measure the signals of R and AnZq species on both the analysed sample and the standard. On the standard, AnZq an R ions beams intensities can be written:
Id(AnZq)=IpC(Z)K(AnZ)α(AnZq)η(AnZq)
Id(R)=Ipη(R)k
k: constant coefficient.
The transmission factors η(AnZq) and η(R) are almost identical: any abnormal settings or primary current variation can then be detected by visualizing the reference signal. A coefficient named « RSF » (for « Relative Sensitivity Factor ») is calculated thanks to Id(AnZq), Id(R) et C(Z) values:
RSF(AnZq,R)=C(Z)Id(R)Id(AnZq) = kη(R)K(AnZ)α(AnZq)η(AnZq)
This coefficient is independent of:
- Z concentration if this one remains low,
- Z isotope, except for hydrogen.
However, a RSF value depends on:
- the detected species AnZq,
- the reference species R,
- the matrix where the Z element exists,
- analysis conditions (primary ion mostly).
The RSF value enables to calculate the concentration C(Z):
C(Z)=RSF(AnZq,R)Id(AnZq)Id(R)
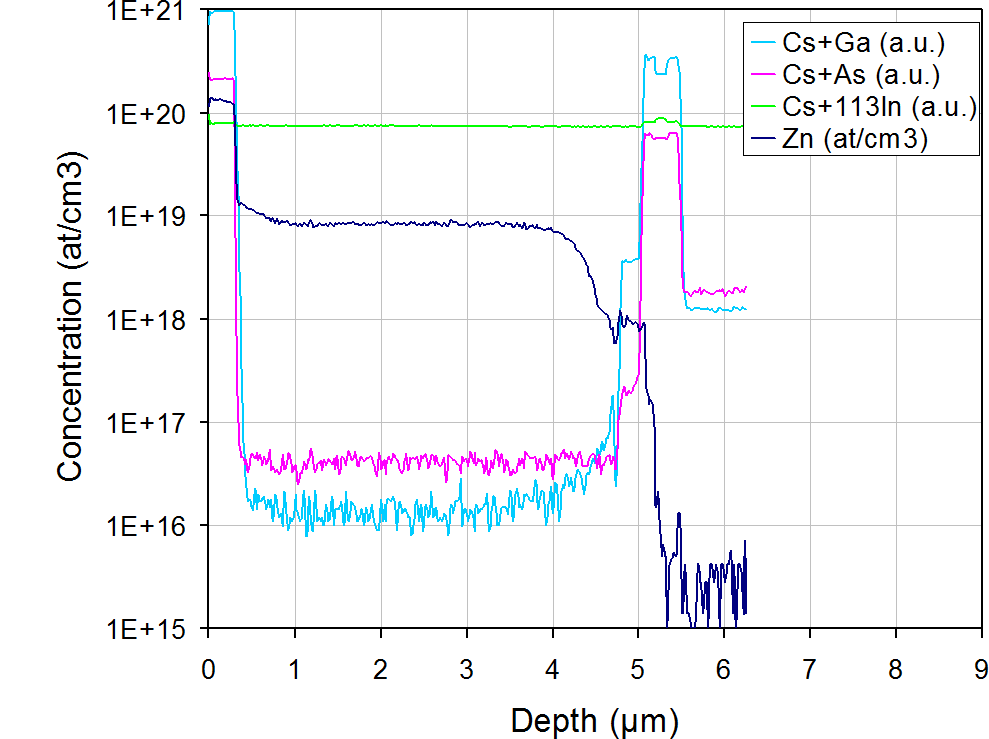
This relation is called « SIMS equation« . Figure 1 shows an example of a zinc concentration profile in an InGaAs heterostructure.
1.2 Major elements concentrations
A major element is an element that belongs to the material matrix. A major element concentration is more difficult to determine than a minor element concentration because of the matrix effect (the ionization rate highly depends on atoms environment in the material).As a result, in most cases, the signal of a monoatomic secondary ion made up of one major element atom is not proportional to this element concentration in the sample.
The matrix effect can be considerably (but not totally) reduced by the analysis modes known as MCs+ and MCs2+. These modes are used to measure matrix compositions. It is necessary then to dispose of a standard made up of the same alloy and SIMS analysis: depths and concentrations calculation whose composition is known. If the sample to analyse and the standard have very close compositions, the quantification accuracy can be better than one percent.
2. Depths
Concentrations profiles as a function of the sputtering time are obtained thanks to the above method. The most classical way to obtain a concentration as a function of depth is to measure the crater depth by profilometry after the profile acquisition. If the matrix is homogeneous from the surface down to the crater bottom, the sputtering rate is considered to be constant during the whole profile acquisition duration:
vsput=pcratertsput
vsput: sputtering rate.
pcrater: crater depth at the end of data acquisition.
tsput: final sputtering time.
The concentration as a function of depth, then, is simply obtained by multiplying the sputtering time by vsput. However, a sample may sometimes have several layers with different matrix compositions. The exact depths can then be obtained by determining the sputtering rates for each layer. Figure 1 shows a profile example as a function of depth. The accuracy typically reaches 2-5%.